🔍 More Refined Data-driven Analytics
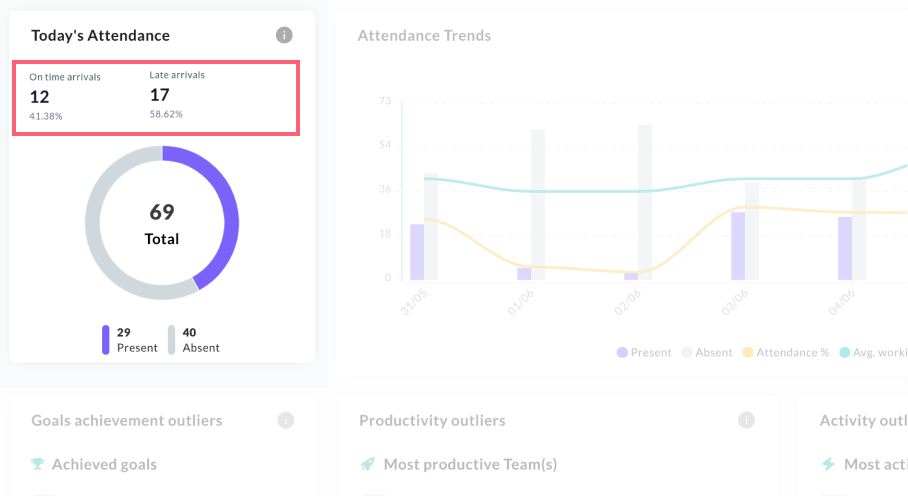
📅 Today’s Attendance:
Easily see how many users have arrived on-time and how many were late. Get all important attendance metrics in just one widget.
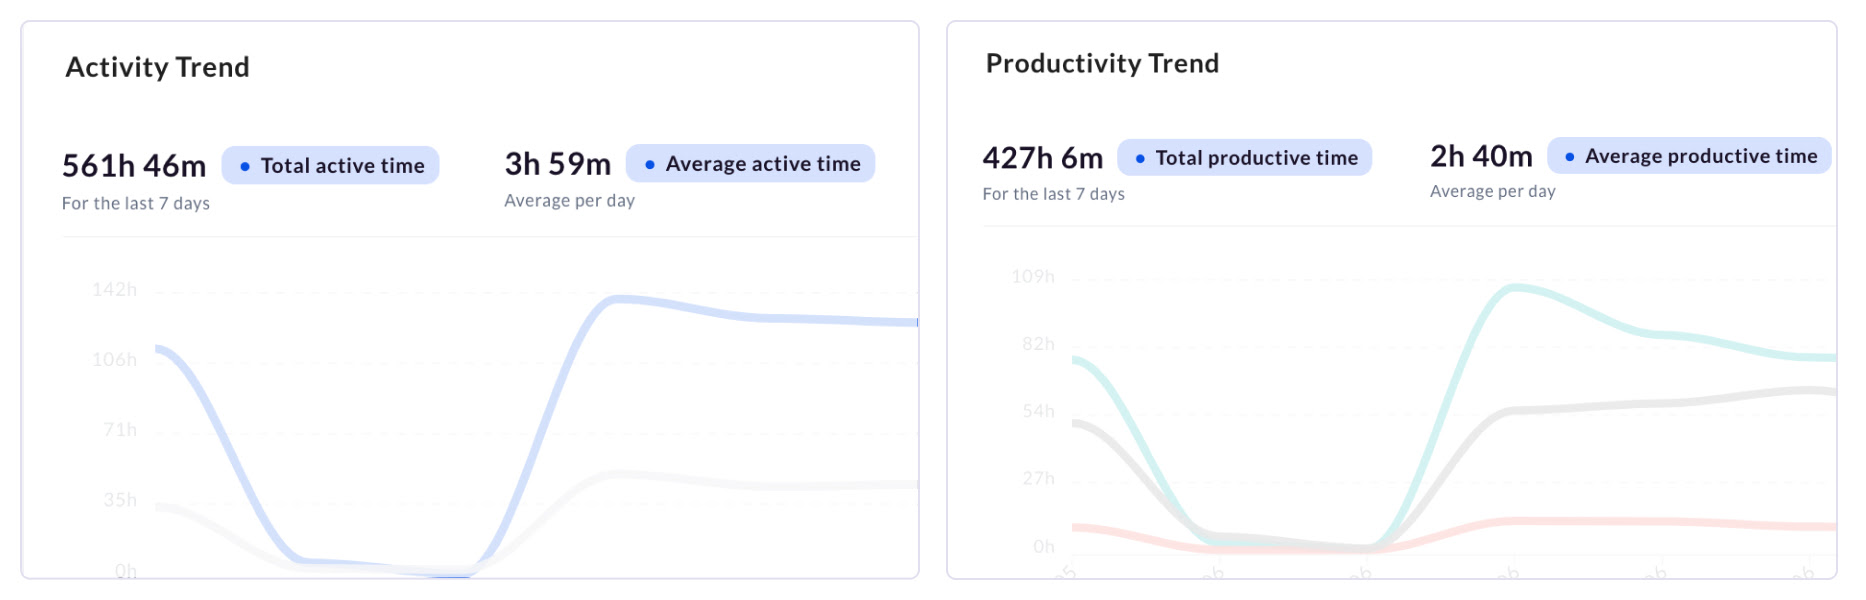
⏱️ Average and Total hours per day
Now see Average hours per day and Total hours across activity, productivity, and online time breakdowns for better insights into your team's working patterns.
Where can you view these values?
On the dashboard, in the Activity Trend graph, you'll find the total active time for a selected date range and the average active time per day per employee for that same date range. This provides a clear picture of how active your employees are on an average day.
You'll also see these metrics in the Productivity Trend graph, Productivity Breakdown pie chart, and Online Time Breakdown pie chart across the activity and productivity modules.
📈 Outliers
We have added Goals outliers. Now see top as well as bottom performers based on goals achievement, productivity and activity.
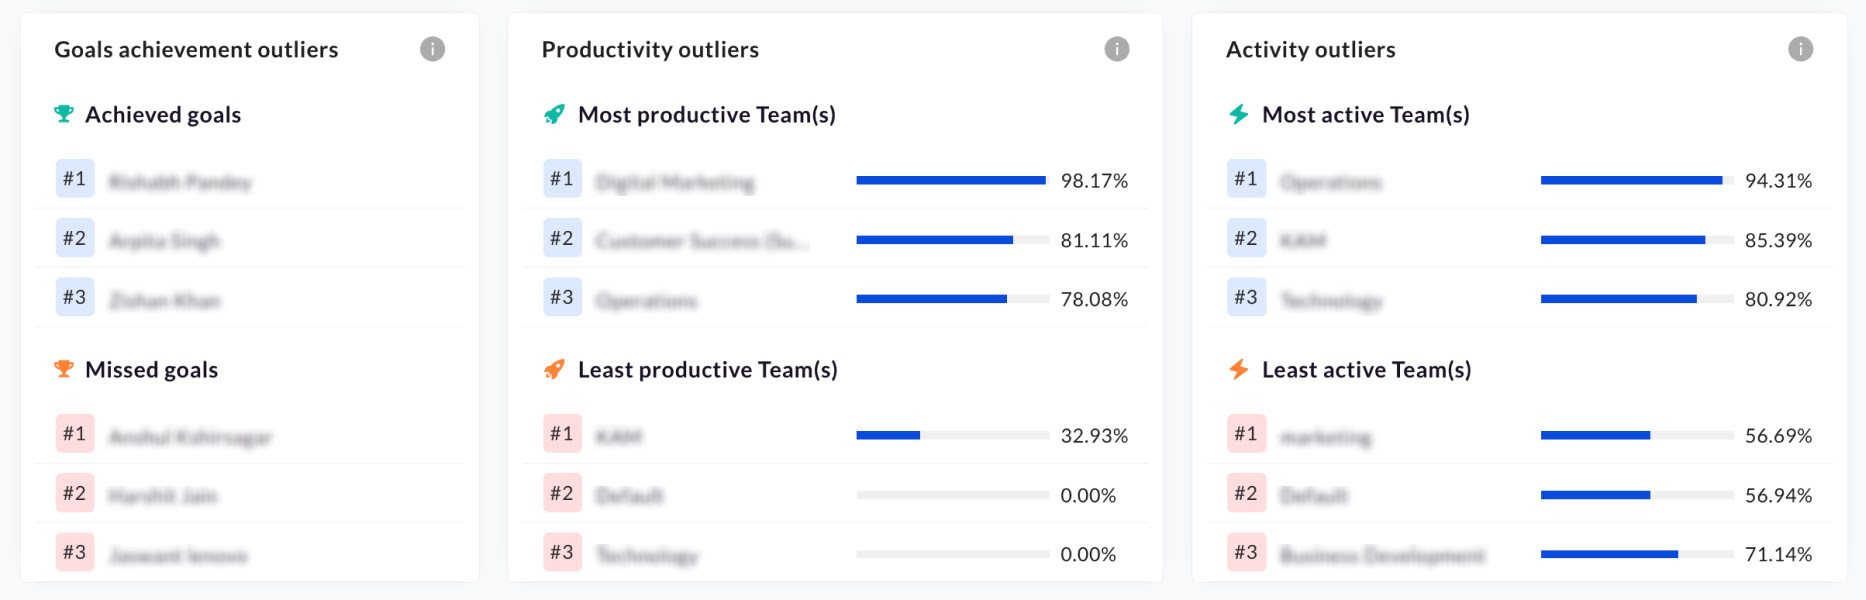
Previously, there were only two outliers: activity and productivity. With this update, we've expanded the leaderboard to include goal achievements, providing a more comprehensive view of performance.
Identify and recognize your high achievers, and support those who need improvement, all from a single, insightful leaderboard.